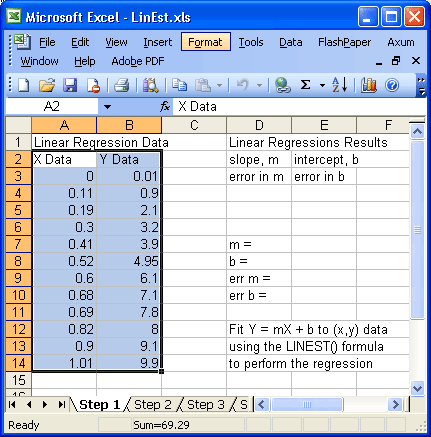
Begin by entering your data and labels into cells in the spread sheet. The example shows data in rows 3-14 of columns A and B. Each column of data has a heading, "X Data" & "Y Data", and the data set is named "Linear Regression Data". If you plan to graph the data, these labels will be useful. In a real case you would indicate the names of the independent (X) and dependent (Y) data.
Columns D and E have text labels in several cells that will tell the reader what adjacent (now empty) data is. This kind of documentation is important so the reader will know what the numbers mean.
Note that A2:B14 (read: "the rectangle bounded by cells A2 and B14 on opposite corners") has been selected and the "Format" menu is hilighted. This is in preparation for formating the selected cells into "Number fix 2" and "Center" formats. See the next image for the results.