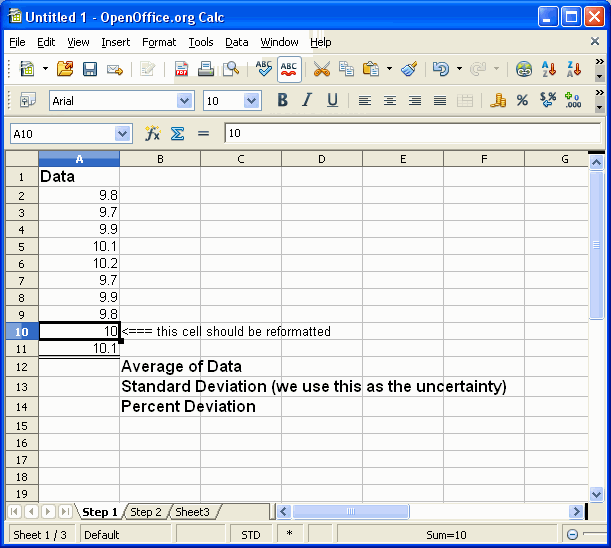
Begin by entering your data and appropriate labels into cells in the spread sheet. The example shows data in rows 2-11 of column A. The data column has a heading, "Data".
The plan is to use cells A12, A13, and A14 to hold the average, standard deviation, and percent deviation of the data in cells A2:A11 (read: "the column of cells from A2 to A11"). Column B has had this information entered as text lables opposite the (now) empty cells so the reader will know what her or she is looking at. This kind of documentation is important so the reader will know what the numbers mean.
Note that cell A10 looks like it holds an integer 10 rather than the data 10.0 This is a problem with the normal formatting in all spread sheet and will be fixed shortly by formating the cell into "Number fix 1" formats.