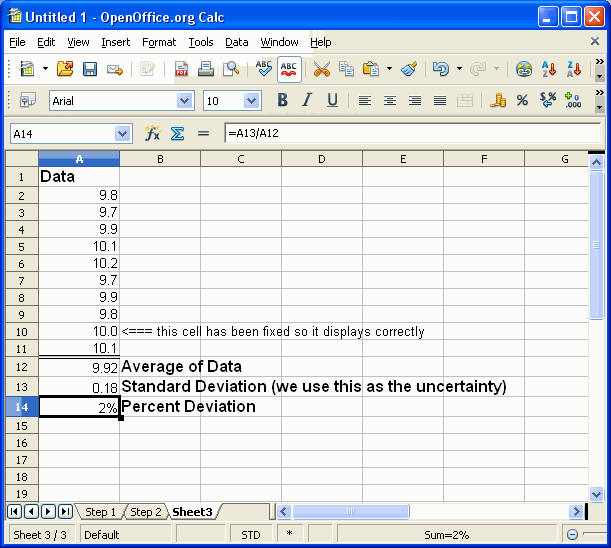
This screen shows the final result. We have formatted cell A14 as a percent. Notice that we also fixed the formatting of cell A10 so that it displays the correct number of decimals.
The spreadsheet shows us our data and the result of our calculations. This is a good place to point out one of the problems or the dangers of using spreadsheet for data analysis. It is relatively easy to see if our data is what we want. We just look at the data cells. However, it is impossible, from the screen shown, to tell if the actual formulas behind cells A12 and A13 are correct. To verify that the calculations are right one would have to click on each cell in turn and then analyze the formula shown in the data panel to see if it was correct. Sometimes that is easy. Some times it can be very difficult, especially if a complex formula is involved. Spreadsheets are designed to hide the formulas that they use to calculate. This makes their presentation look very simple. It makes them very hard to validate or audit. Be warned.
That ends our tutorial on using a spreadsheet to compute the average of a set of numbers, their standard deviation, and to express the standard deviation as a percent of the average. These are common tasks when analyzing data.
Click on next screen to go home.